> ## Documentation Index
> Fetch the complete documentation index at: https://ngquct-feat-sql-code-folding.mintlify.site/llms.txt
> Use this file to discover all available pages before exploring further.
# EXPLAIN Visualization
> View query execution plans as diagrams, trees, or raw output
Click **Explain** in the query editor toolbar, or use **Query > Explain Query** (default shortcut `Cmd+Option+E`), to get the execution plan for the current query.
Databases with multiple EXPLAIN variants show a dropdown: PostgreSQL offers **EXPLAIN** (estimated plan) and **EXPLAIN ANALYZE** (runs the query and shows actual timing); MySQL and MariaDB offer **EXPLAIN** and **EXPLAIN (JSON)**. Databases with a single variant, like SQLite or DuckDB, show a plain Explain button.
Typing an `EXPLAIN`, `EXPLAIN ANALYZE`, `EXPLAIN FORMAT=JSON`, or MariaDB's `ANALYZE FORMAT=JSON` statement in the editor and running it opens the same plan viewer. MySQL's TREE and ANALYZE text output is parsed into the diagram and tree views. Multi-column plans like MySQL's plain `EXPLAIN` table stay in the results grid, but a multi-column plan the driver itself declares, such as SQLite's `EXPLAIN QUERY PLAN`, still opens the viewer.
The plan arrives as a result tab next to your query results, so you can switch back to the data without running the query again, and you can pin a plan to keep it while you try another query.
 ## View Modes
Toggle between three views using the segmented control above the results:
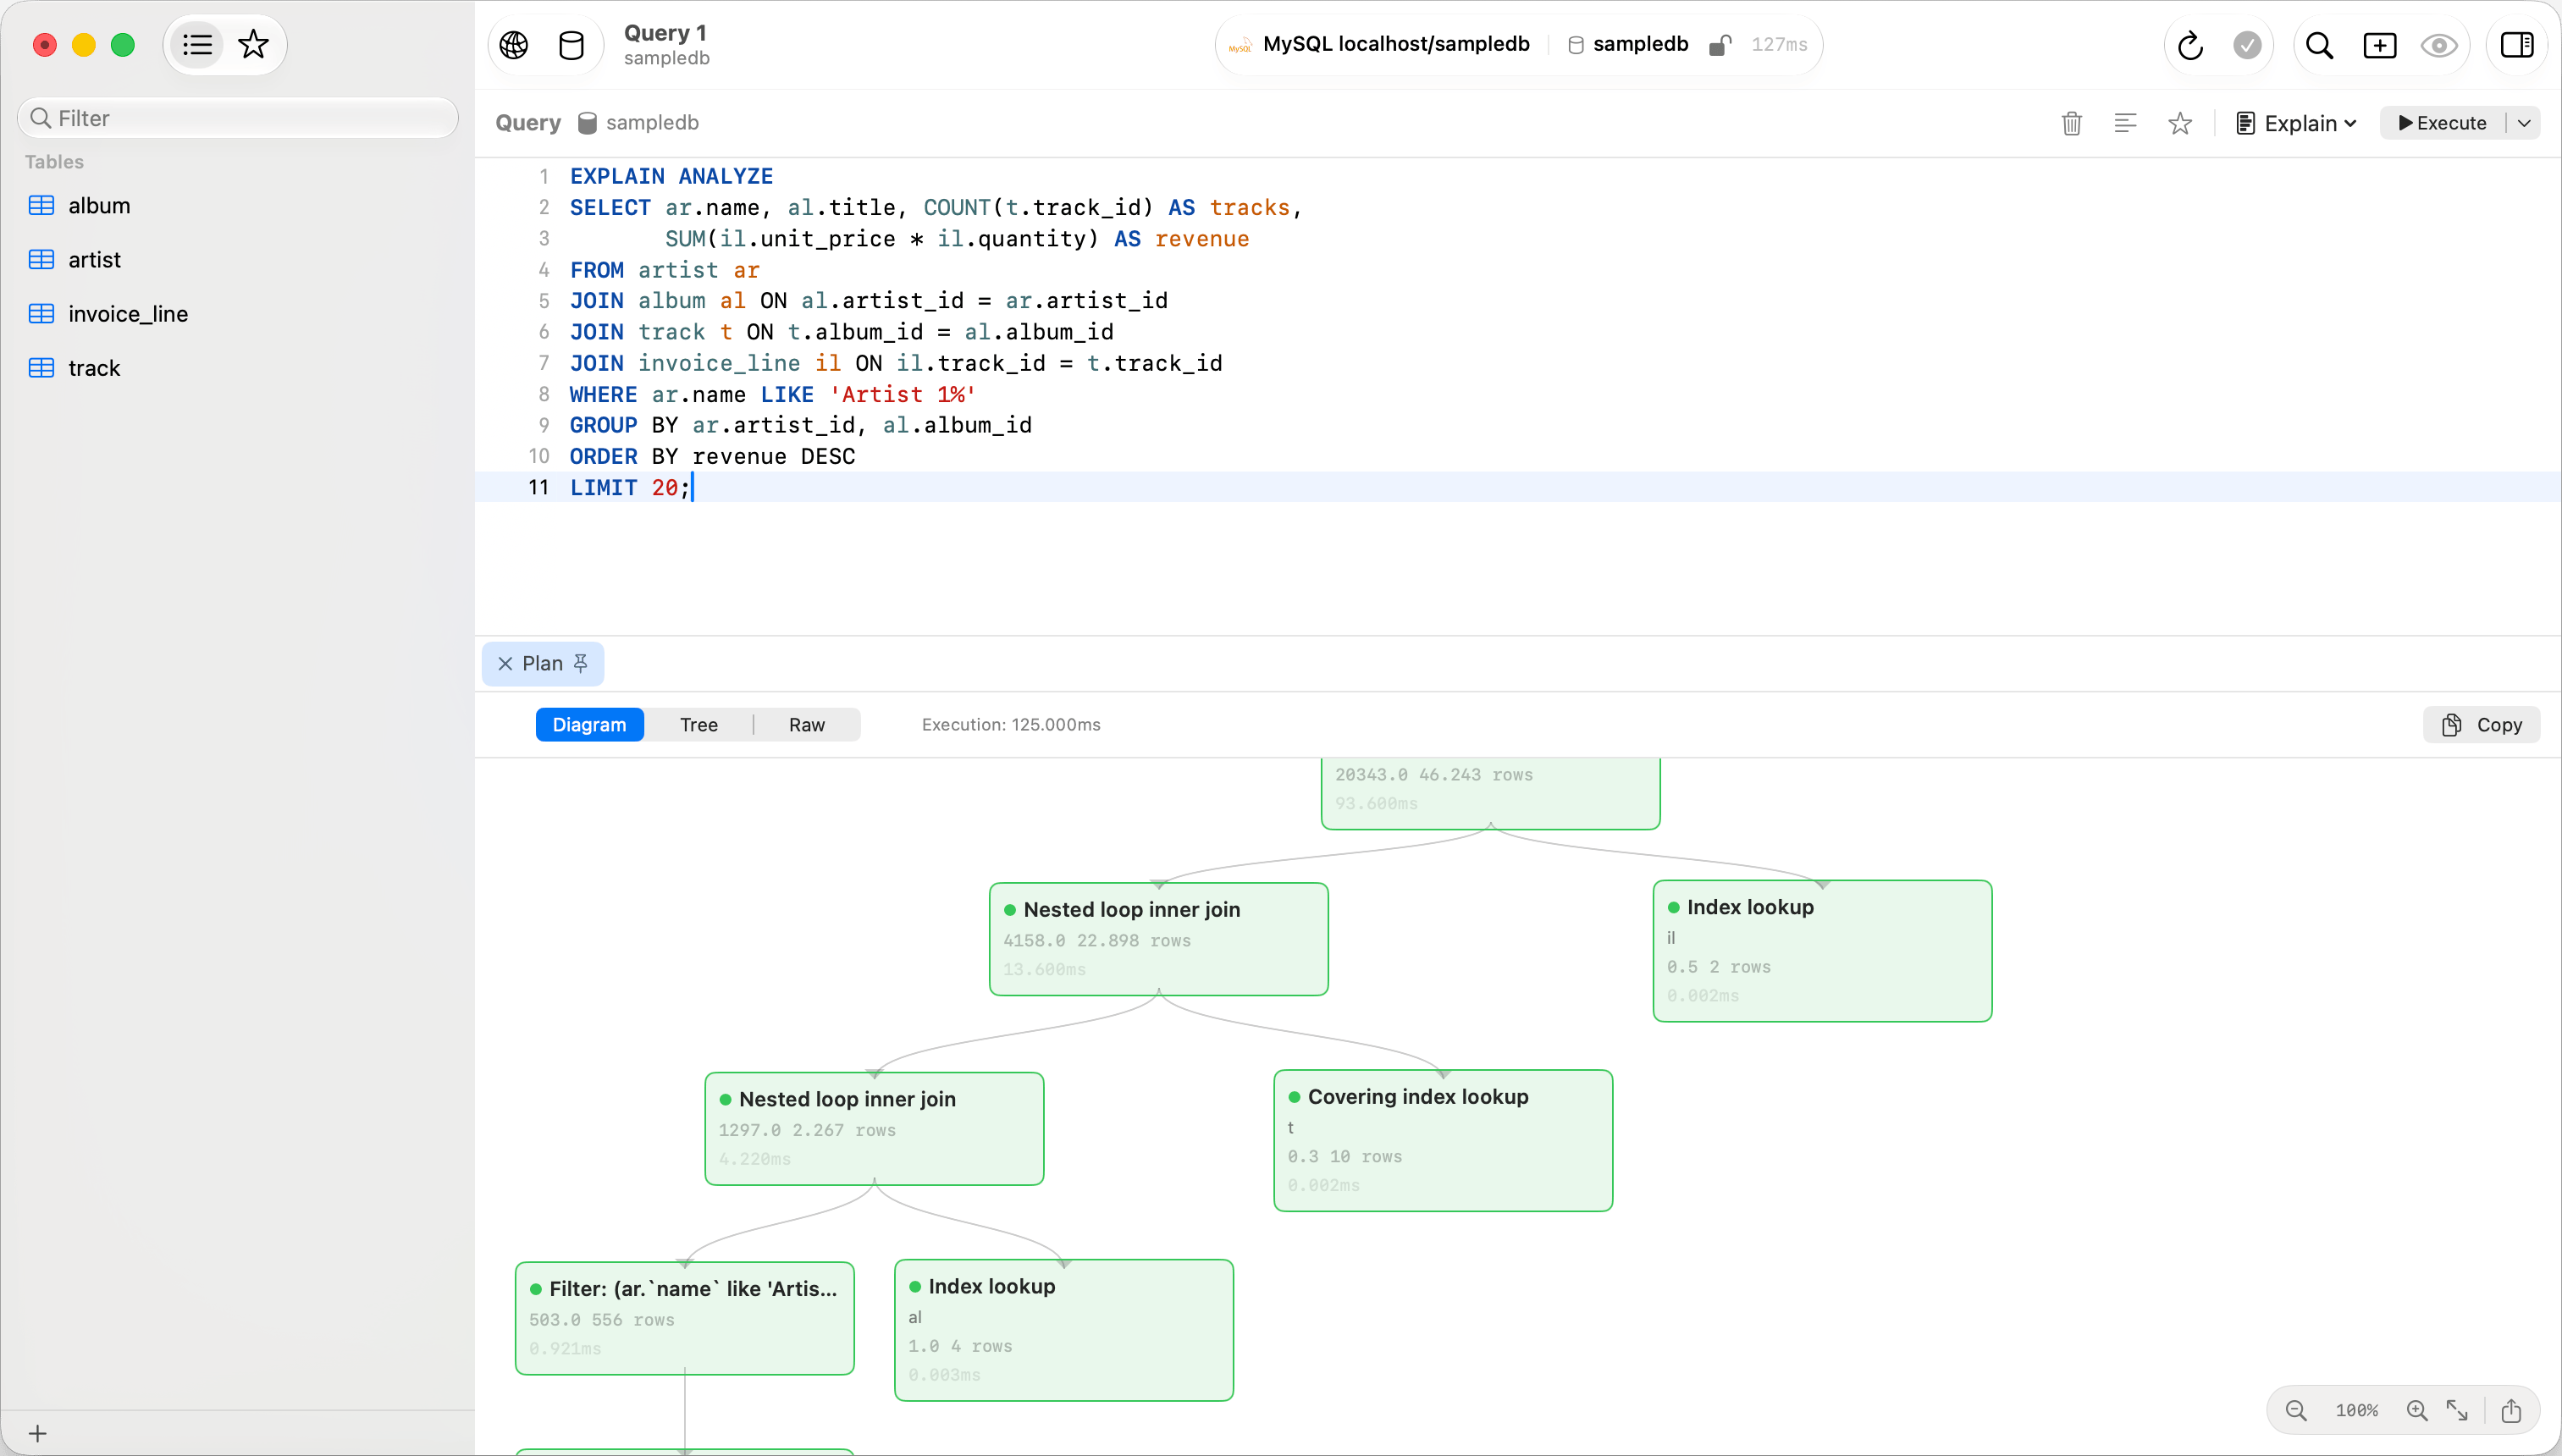
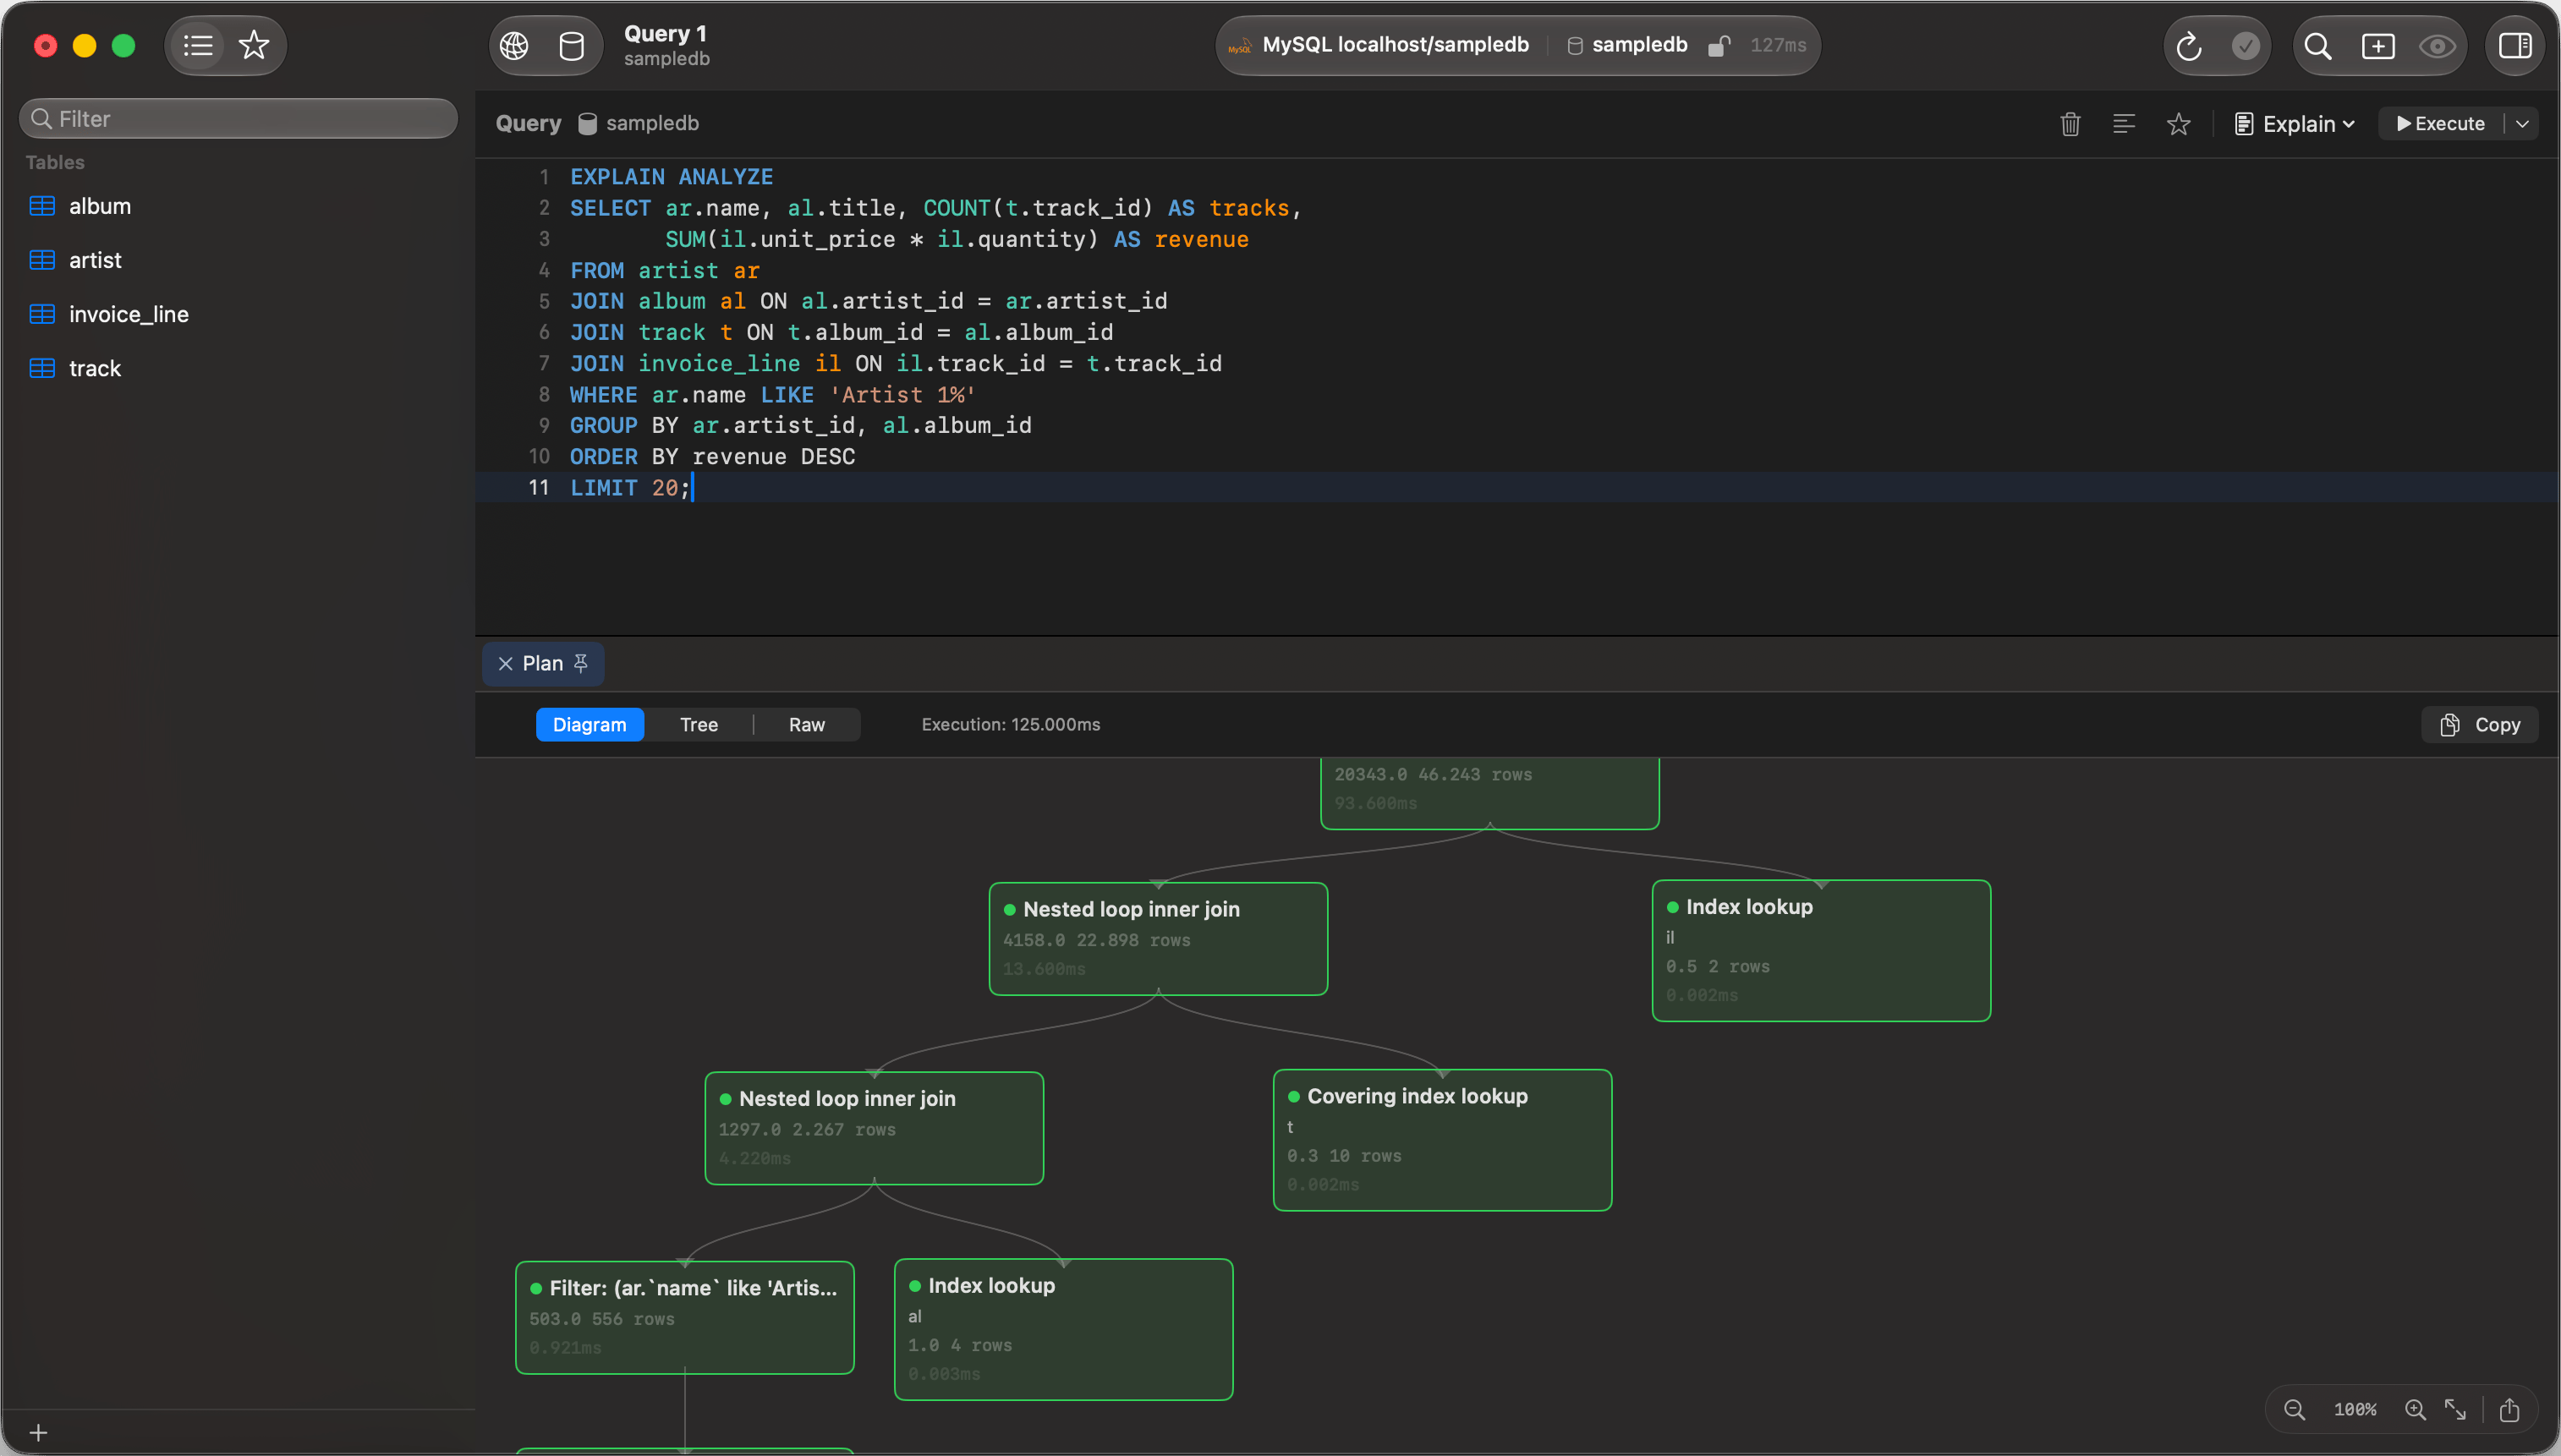
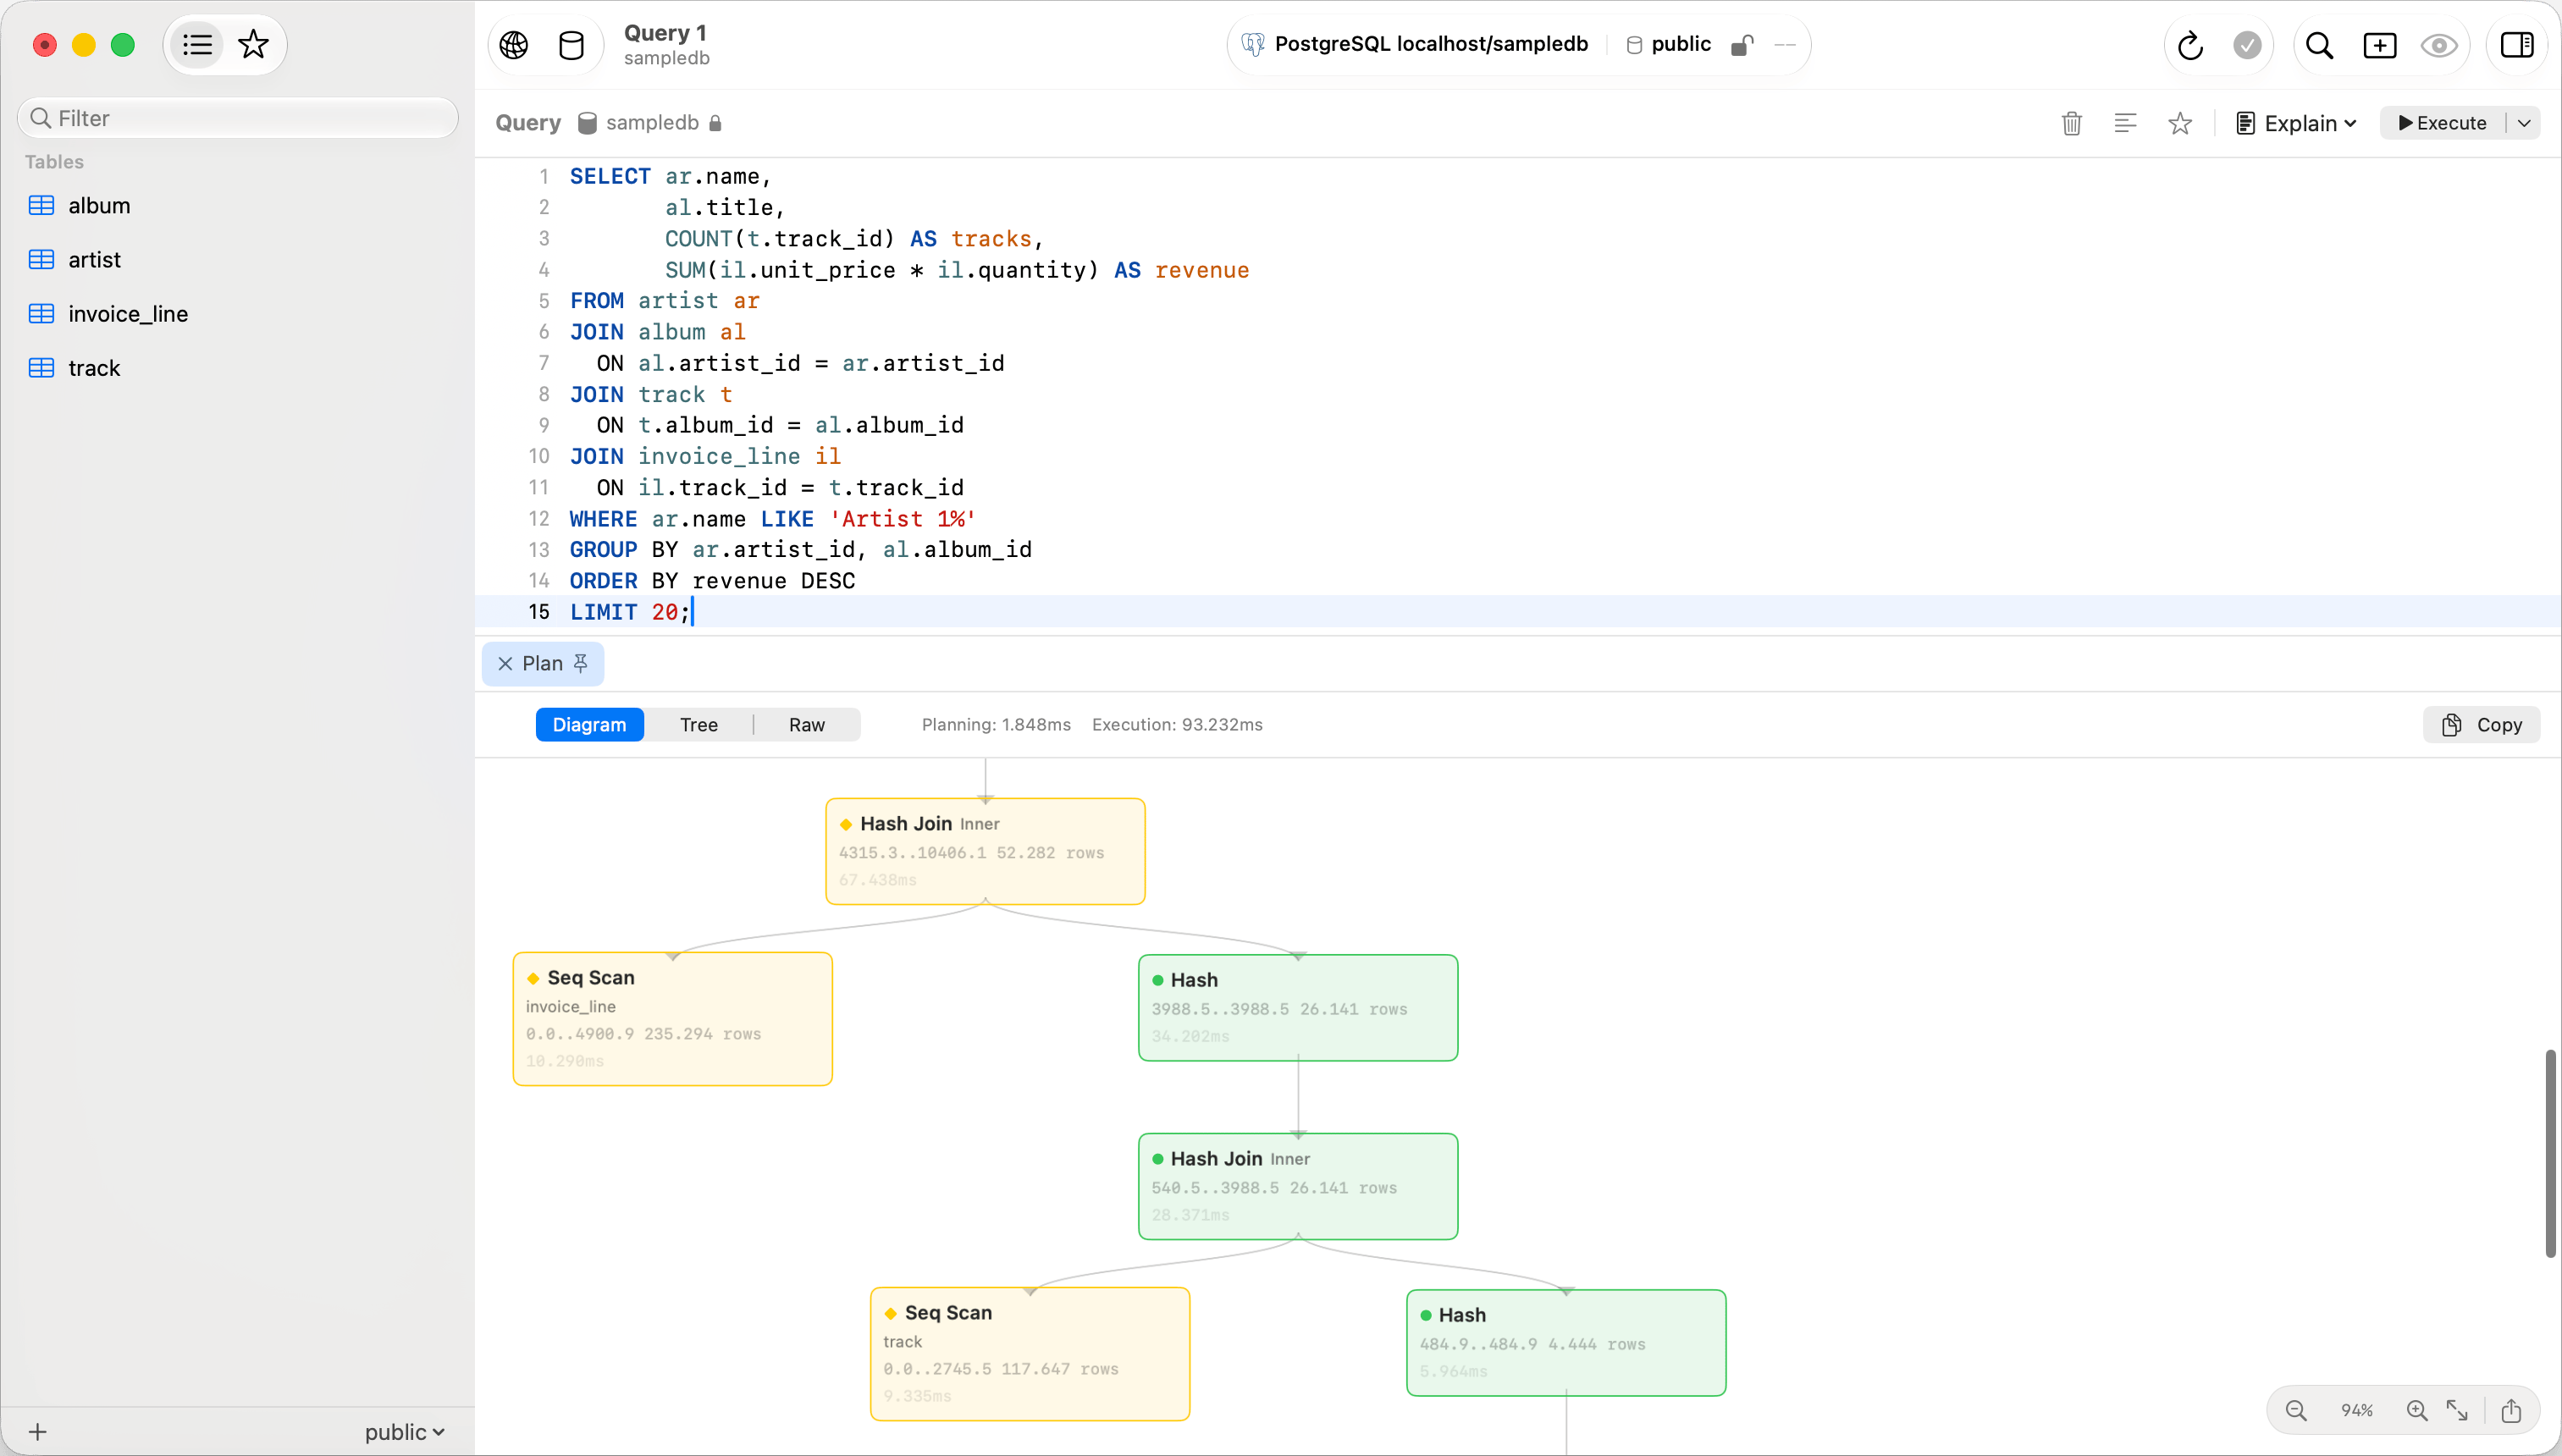
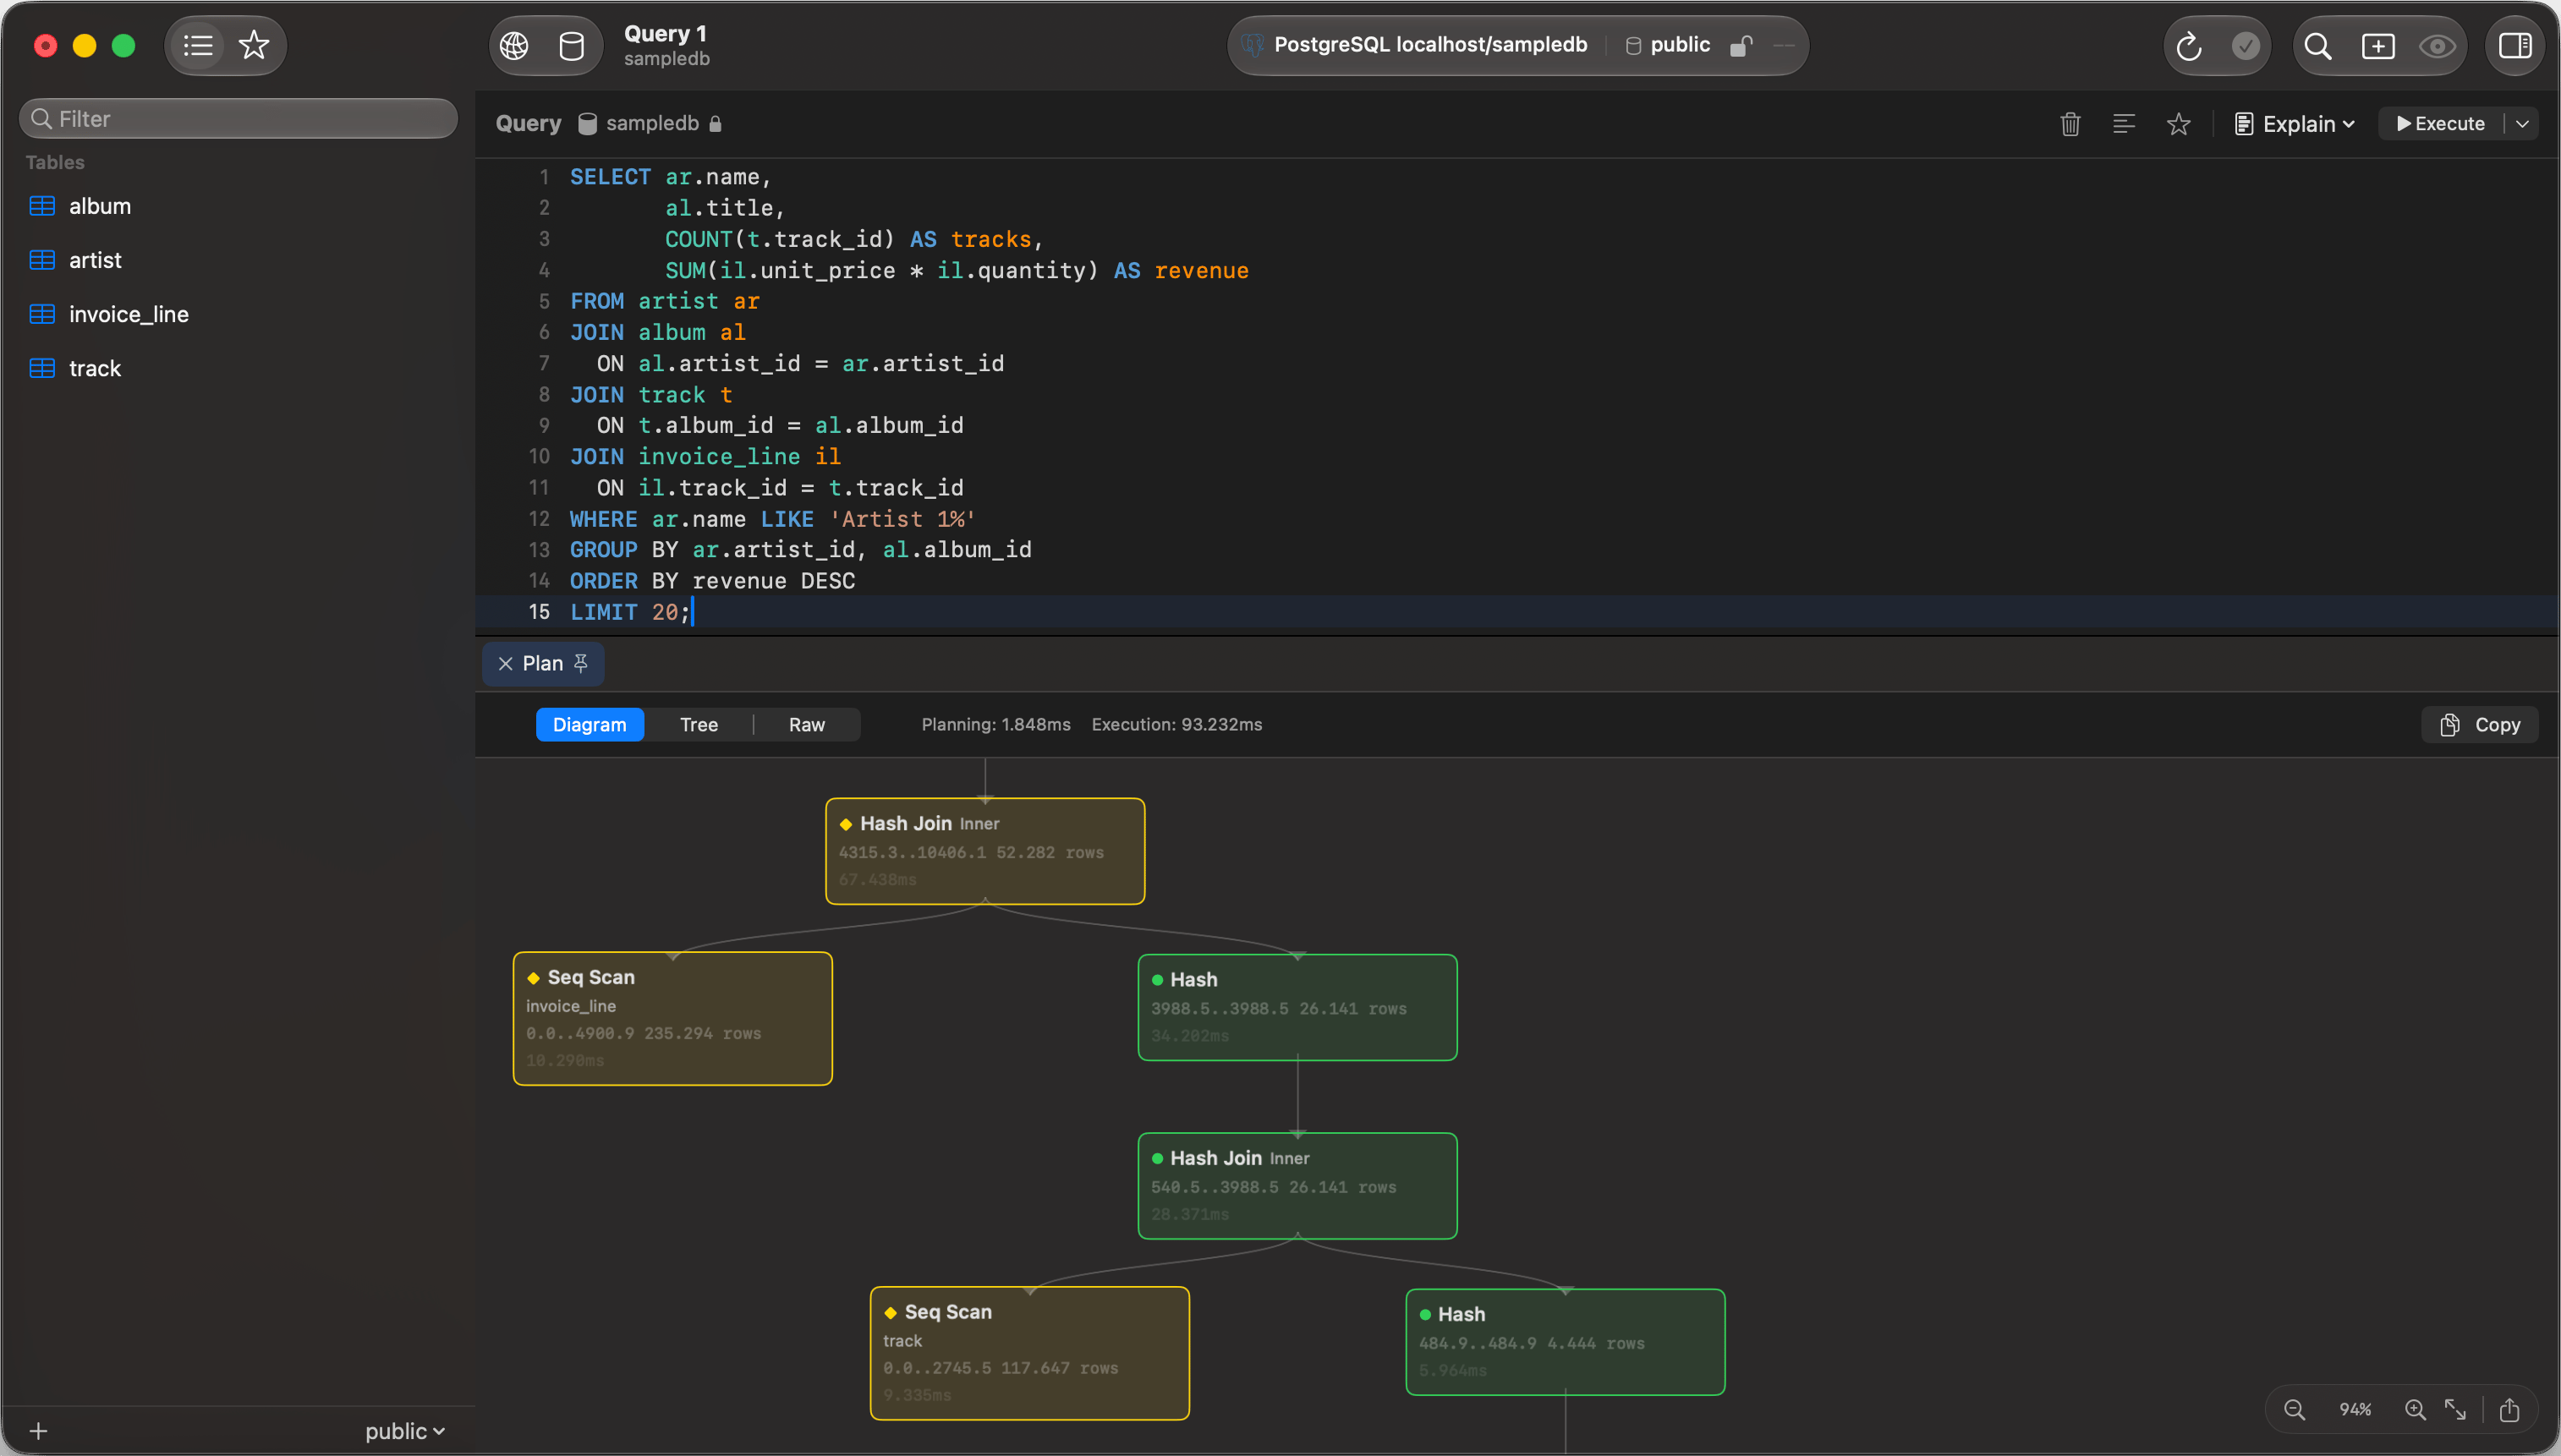
**Diagram** shows the plan as boxes connected by arrows, top to bottom. Each node carries a cost badge whose shape and color escalate together, from a green circle for a cheap step to a red warning triangle for the most expensive one, so the plan reads without relying on color alone.
Zoom with a trackpad pinch, a two-finger double tap, or Cmd and scroll. The controls in the bottom-right corner zoom in and out, reset to 100%, and fit the whole plan to the window. Click a node for its full details, right-click to copy a step, and use Copy or the export button to save the diagram as a PNG.
## View Modes
Toggle between three views using the segmented control above the results:
**Diagram** shows the plan as boxes connected by arrows, top to bottom. Each node carries a cost badge whose shape and color escalate together, from a green circle for a cheap step to a red warning triangle for the most expensive one, so the plan reads without relying on color alone.
Zoom with a trackpad pinch, a two-finger double tap, or Cmd and scroll. The controls in the bottom-right corner zoom in and out, reset to 100%, and fit the whole plan to the window. Click a node for its full details, right-click to copy a step, and use Copy or the export button to save the diagram as a PNG.
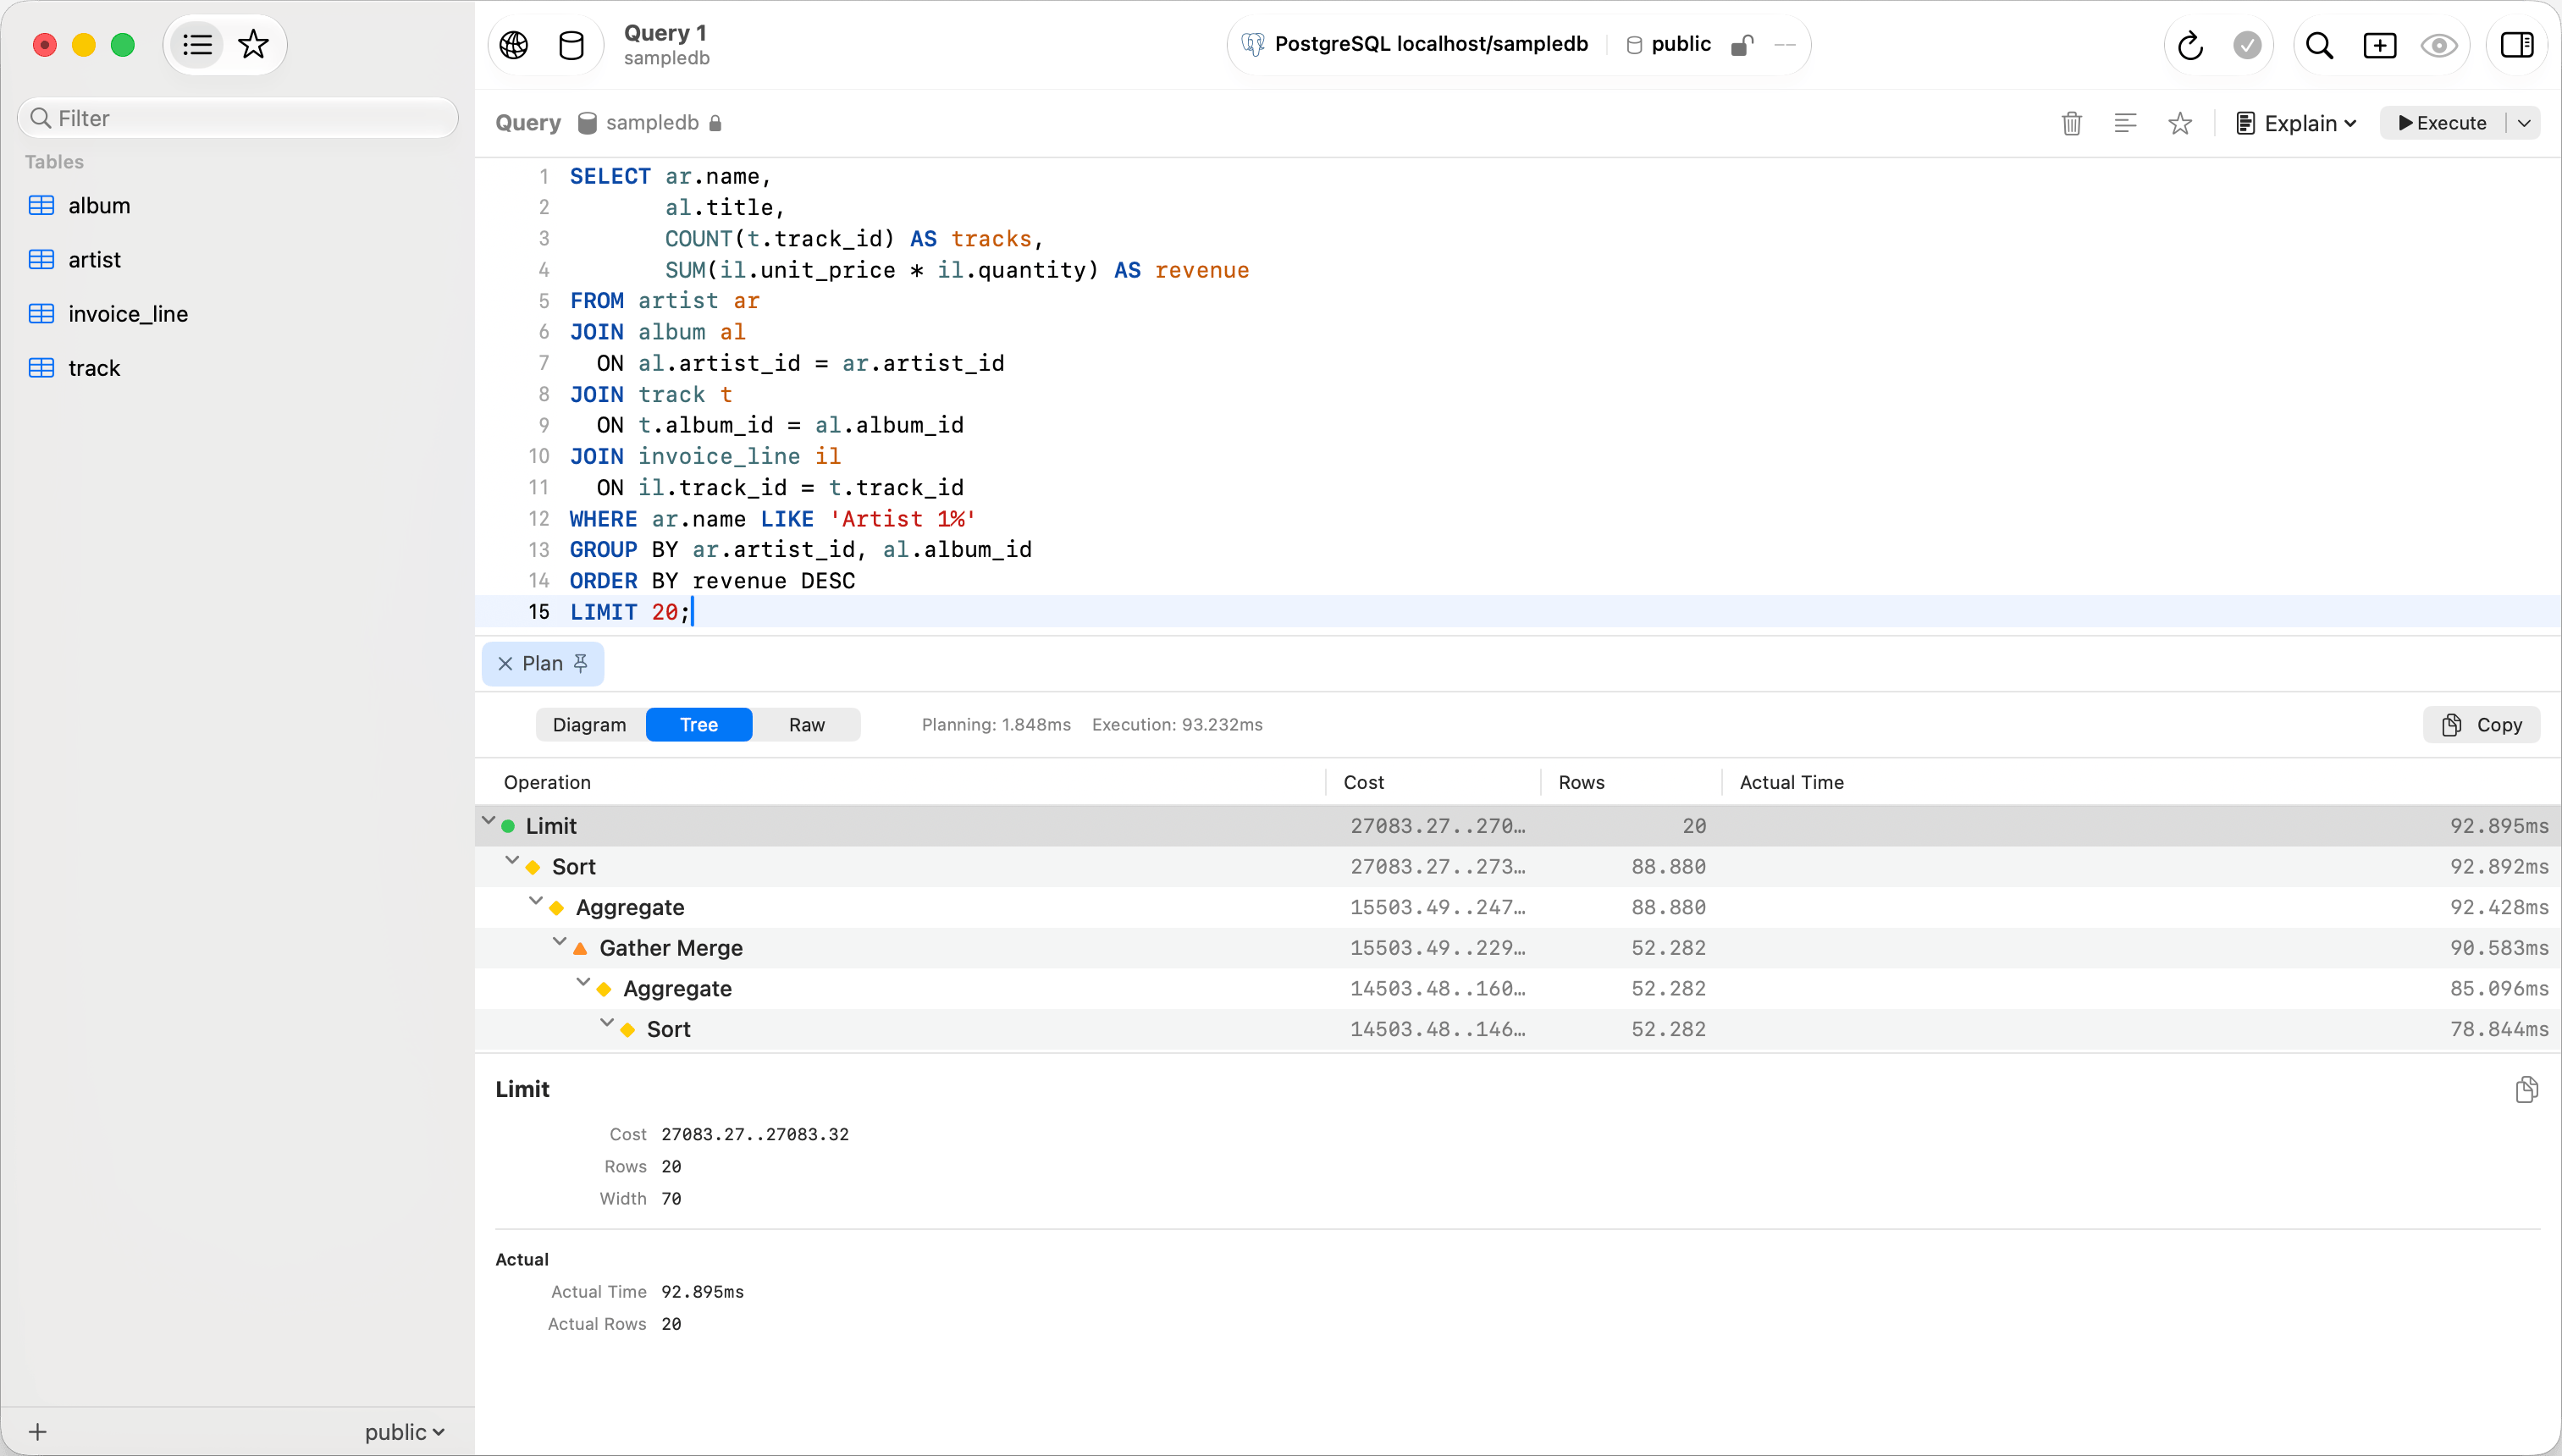
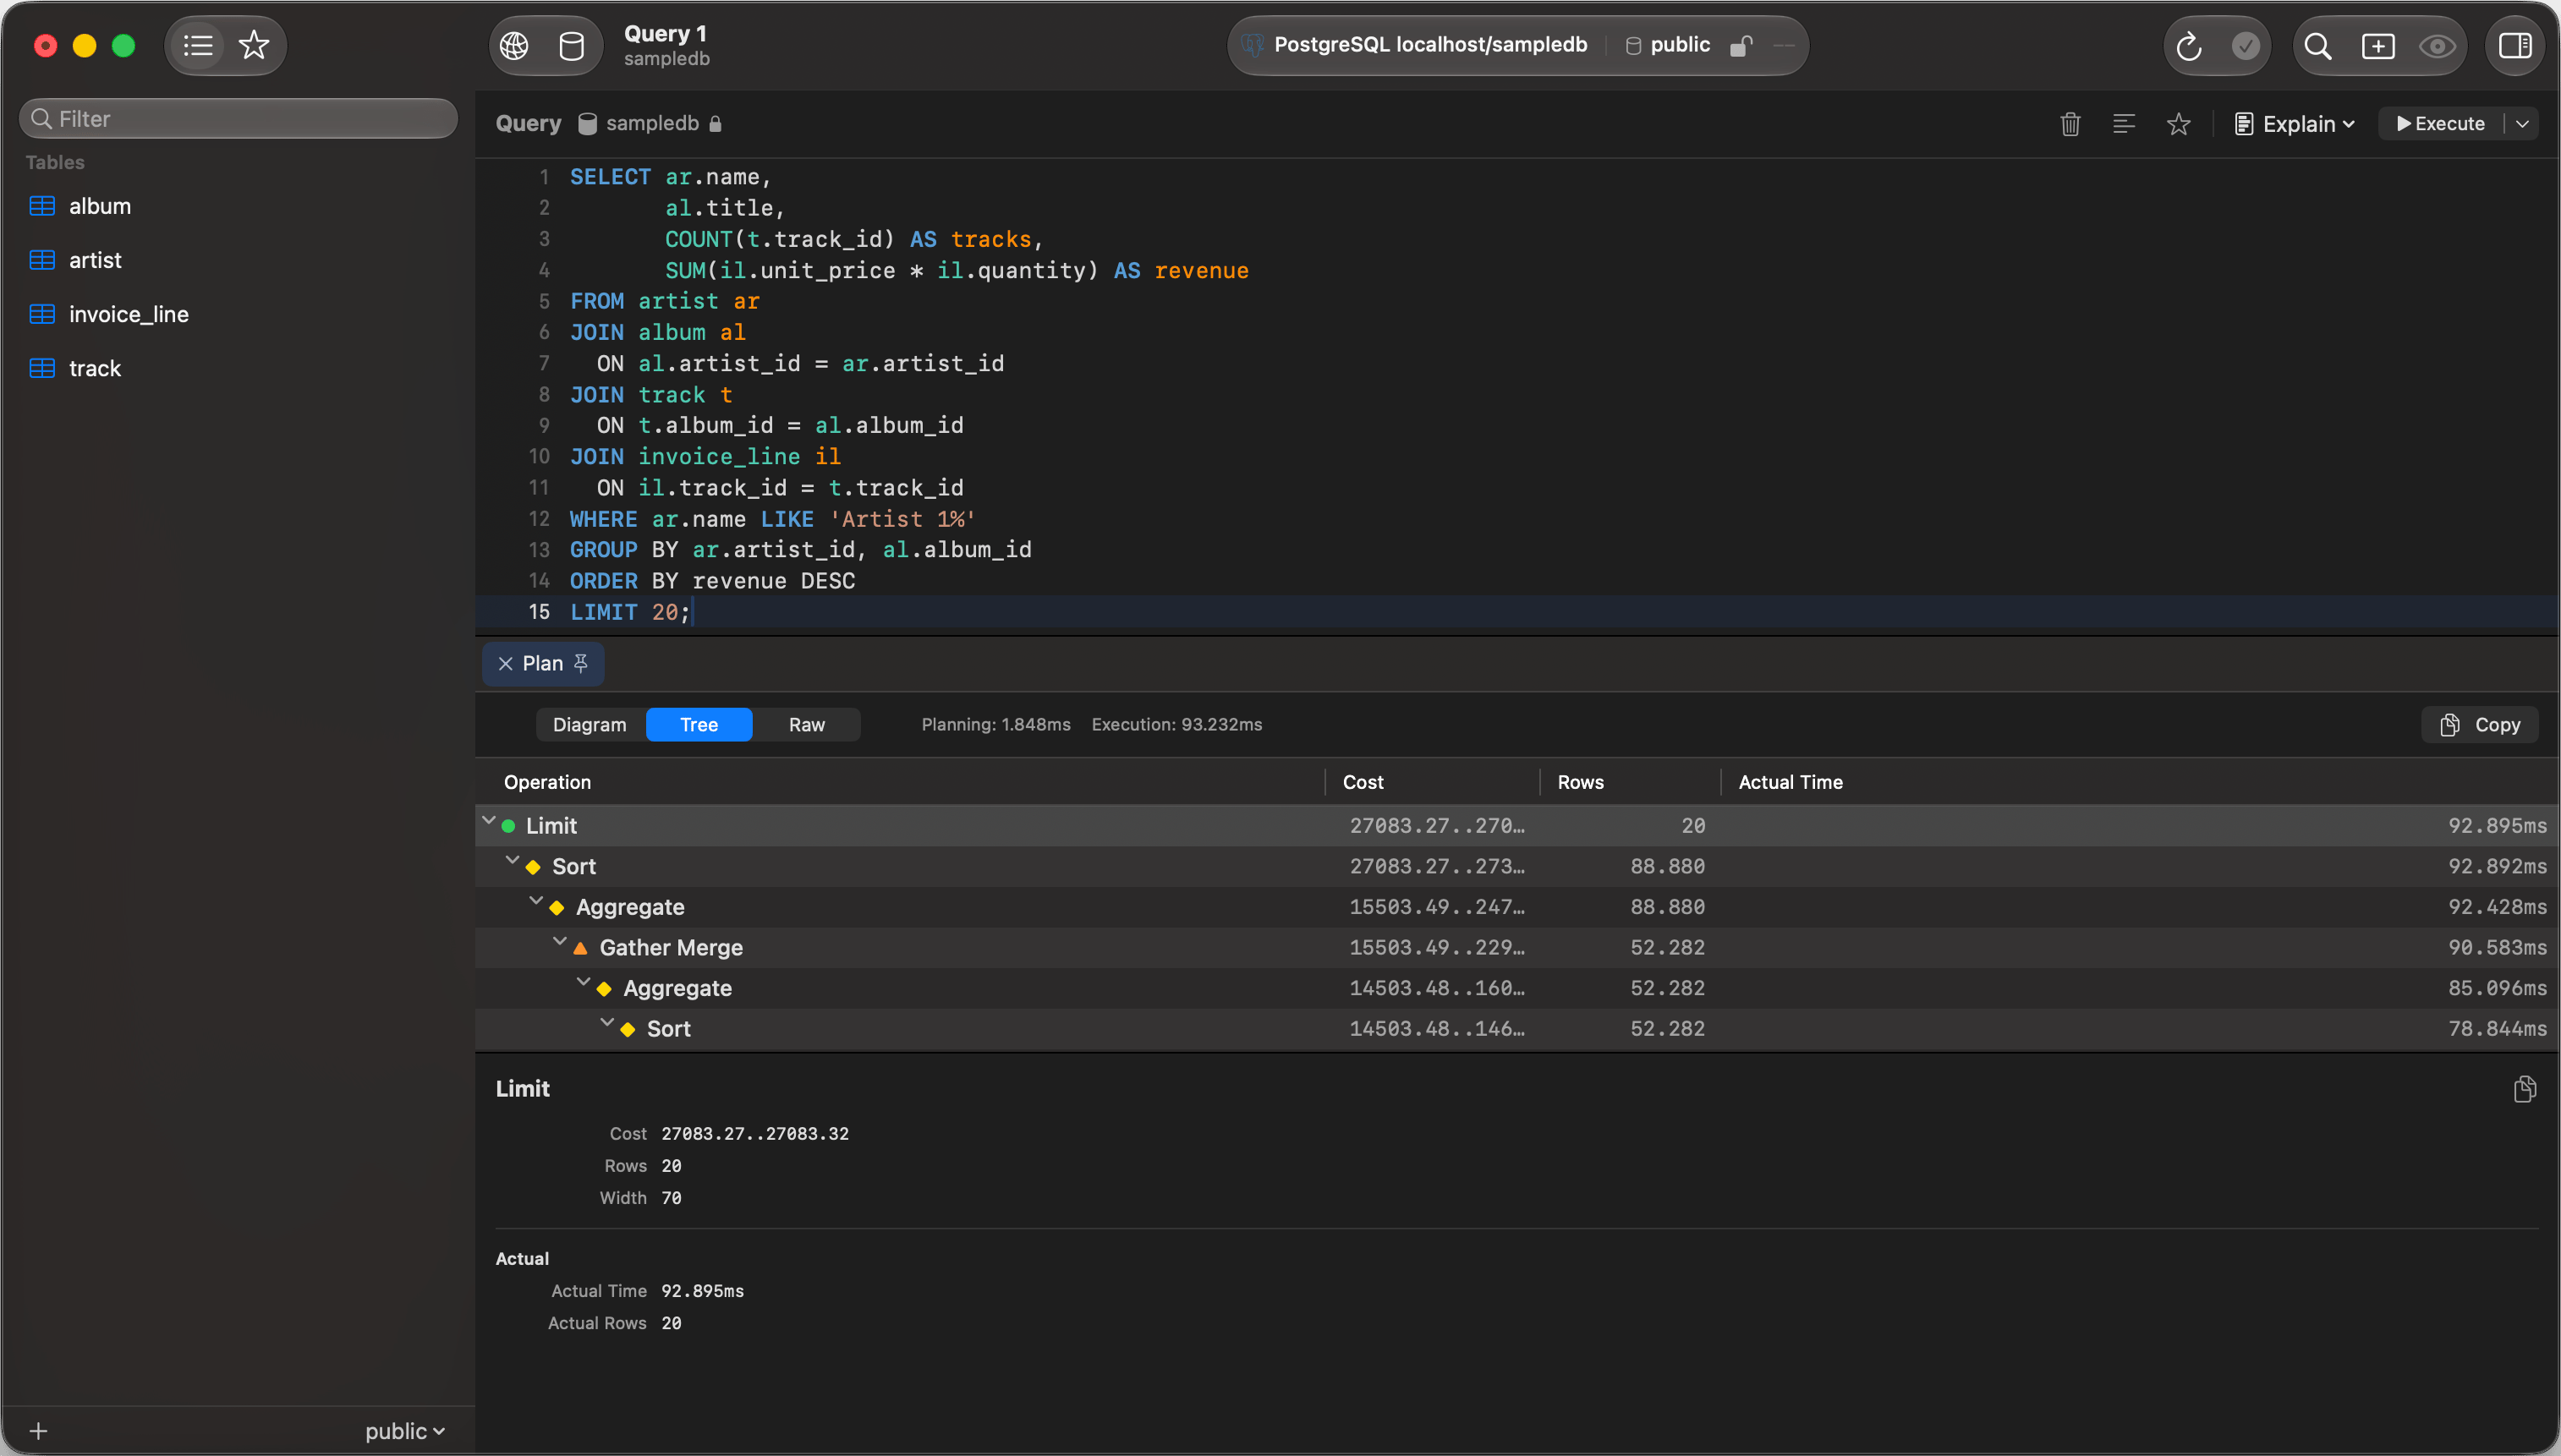 **Tree** shows the plan as an expandable outline with **Operation**, **Cost**, **Rows** and **Actual Time** columns. Drag a column edge to resize it and TablePro remembers the width. Click a column header to sort, which reorders the steps under each parent without flattening the plan. Arrow keys move between steps, and right-click copies a step. The detail panel below the outline can be resized by dragging the divider.
**Raw** shows the original EXPLAIN output as text, with a copy button and a font size stepper in the toolbar. When the plan includes timing, planning and execution times are shown next to the view switcher.
## Database Support
| Database | Variants | Output |
| -------------- | ------------------------------------------------------------------------------------------- | ------------------------------------------------------------------------------------------ |
| PostgreSQL | EXPLAIN, EXPLAIN ANALYZE | JSON, parsed into diagram and tree |
| PGlite | EXPLAIN, EXPLAIN ANALYZE | PostgreSQL's `EXPLAIN (FORMAT JSON)`, parsed into diagram and tree |
| Redshift | EXPLAIN, EXPLAIN ANALYZE | PostgreSQL's `EXPLAIN (FORMAT JSON)`, read by the PostgreSQL plan parser |
| CockroachDB | EXPLAIN, EXPLAIN ANALYZE | Text plan, parsed into diagram and tree |
| MySQL | EXPLAIN, EXPLAIN (JSON); typed EXPLAIN FORMAT=TREE or EXPLAIN ANALYZE | JSON and TREE output parsed into diagram and tree; plain EXPLAIN stays in the results grid |
| MariaDB | EXPLAIN, EXPLAIN (JSON); typed ANALYZE FORMAT=JSON | JSON output parsed into diagram and tree; plain EXPLAIN stays in the results grid |
| SQLite | Explain | EXPLAIN QUERY PLAN, parsed into diagram and tree |
| ClickHouse | Plan, Pipeline, AST, Syntax, Estimate | Indented text, parsed into diagram and tree |
| DuckDB | Explain | Indented text, parsed into diagram and tree |
| Cloudflare D1 | Query Plan | EXPLAIN QUERY PLAN, parsed into diagram and tree |
| LibSQL / Turso | Query Plan | EXPLAIN QUERY PLAN, parsed into diagram and tree |
| Snowflake | Explain (Text) | Raw text |
| Trino | Explain (Logical), Explain (Distributed), Explain (IO), Explain (Validate), Explain Analyze | Raw text |
| SurrealDB | Explain, Explain Full | Raw text |
| BigQuery | Dry Run (Cost) | Dry run cost estimate |
| MongoDB | Explain | `explain` runCommand with execution stats |
| Redis | Explain | `DEBUG OBJECT` for the command's key |
## Plan Details
Each node in the plan shows:
* **Operation**: Seq Scan, Index Scan, Hash Join, Nested Loop, Sort, etc.
* **Table**: which table the operation accesses
* **Cost**: startup and total cost estimates (PostgreSQL format: 0.00..45.18)
* **Rows**: estimated number of rows
* **Actual time**: real execution time per node (EXPLAIN ANALYZE only)
Click a node to see all properties including join type, index name, filter conditions, and sort keys.
`EXPLAIN ANALYZE` runs the query. When Safe Mode asks for confirmation before running a query, it now asks before an EXPLAIN too, whichever way you started it. Use the Stop button to cancel one that is taking too long.
EXPLAIN does not execute the query. EXPLAIN ANALYZE executes it and shows actual timing; use it cautiously on production systems.
**Tree** shows the plan as an expandable outline with **Operation**, **Cost**, **Rows** and **Actual Time** columns. Drag a column edge to resize it and TablePro remembers the width. Click a column header to sort, which reorders the steps under each parent without flattening the plan. Arrow keys move between steps, and right-click copies a step. The detail panel below the outline can be resized by dragging the divider.
**Raw** shows the original EXPLAIN output as text, with a copy button and a font size stepper in the toolbar. When the plan includes timing, planning and execution times are shown next to the view switcher.
## Database Support
| Database | Variants | Output |
| -------------- | ------------------------------------------------------------------------------------------- | ------------------------------------------------------------------------------------------ |
| PostgreSQL | EXPLAIN, EXPLAIN ANALYZE | JSON, parsed into diagram and tree |
| PGlite | EXPLAIN, EXPLAIN ANALYZE | PostgreSQL's `EXPLAIN (FORMAT JSON)`, parsed into diagram and tree |
| Redshift | EXPLAIN, EXPLAIN ANALYZE | PostgreSQL's `EXPLAIN (FORMAT JSON)`, read by the PostgreSQL plan parser |
| CockroachDB | EXPLAIN, EXPLAIN ANALYZE | Text plan, parsed into diagram and tree |
| MySQL | EXPLAIN, EXPLAIN (JSON); typed EXPLAIN FORMAT=TREE or EXPLAIN ANALYZE | JSON and TREE output parsed into diagram and tree; plain EXPLAIN stays in the results grid |
| MariaDB | EXPLAIN, EXPLAIN (JSON); typed ANALYZE FORMAT=JSON | JSON output parsed into diagram and tree; plain EXPLAIN stays in the results grid |
| SQLite | Explain | EXPLAIN QUERY PLAN, parsed into diagram and tree |
| ClickHouse | Plan, Pipeline, AST, Syntax, Estimate | Indented text, parsed into diagram and tree |
| DuckDB | Explain | Indented text, parsed into diagram and tree |
| Cloudflare D1 | Query Plan | EXPLAIN QUERY PLAN, parsed into diagram and tree |
| LibSQL / Turso | Query Plan | EXPLAIN QUERY PLAN, parsed into diagram and tree |
| Snowflake | Explain (Text) | Raw text |
| Trino | Explain (Logical), Explain (Distributed), Explain (IO), Explain (Validate), Explain Analyze | Raw text |
| SurrealDB | Explain, Explain Full | Raw text |
| BigQuery | Dry Run (Cost) | Dry run cost estimate |
| MongoDB | Explain | `explain` runCommand with execution stats |
| Redis | Explain | `DEBUG OBJECT` for the command's key |
## Plan Details
Each node in the plan shows:
* **Operation**: Seq Scan, Index Scan, Hash Join, Nested Loop, Sort, etc.
* **Table**: which table the operation accesses
* **Cost**: startup and total cost estimates (PostgreSQL format: 0.00..45.18)
* **Rows**: estimated number of rows
* **Actual time**: real execution time per node (EXPLAIN ANALYZE only)
Click a node to see all properties including join type, index name, filter conditions, and sort keys.
`EXPLAIN ANALYZE` runs the query. When Safe Mode asks for confirmation before running a query, it now asks before an EXPLAIN too, whichever way you started it. Use the Stop button to cancel one that is taking too long.
EXPLAIN does not execute the query. EXPLAIN ANALYZE executes it and shows actual timing; use it cautiously on production systems.